National IQs (Probably) Aren't Valid
National IQ estimates are neither robust nor reliable

I was gratified to see Cremieux write a defense of national IQ estimates. He has forgotten more about IQ data and psychometrics than I will probably ever know and so I should be hesitant about arguing this topic with him. But his critiques seem to be overwhelmingly aimed at fighting yesterday’s war, i.e. rehashing debates that arose from Lynn’s initial publication. I think there are more interesting critiques. I will frame those critiques as questions. I don’t think I know all of the answers to these questions, but I’m reasonably confident IQ advocates have not yet published even halfway satisfactory answers to them. The reason I am confident of this is that Cremieux 's defense of national IQ figures does not anticipate any of these questions or critiques in a reasonable way.
Does IQ change over time?
If IQ does not change over time, why do estimates of IQ change so much over time?
If IQ does change over time, why don’t observed changes correctly predict economic growth?
Do countries with low estimated mean IQs still have approximately normal IQ distributions around those means?
Provided that low measured IQs are not entirely due to certain ancestries having generally worse genes for IQ (most hereditarians suggest they are maybe 30-60% environmental), and that schooling doesn’t cause IQ gains, and that better nutrition doesn’t cause IQ gains, doesn’t this suggest the environmental sources of low IQ must be things like parasite load, serious childhood fever, cerebral malaria, and significant blunt trauma; i.e. incidents which should generate significant functional deficits even aside from their IQ effects, and, thus, doesn’t this suggest that the entire argument about “familial IQ” being different from other functional deficits does not apply to Africa?
Okay, but really, just how reliable are these scores, if and when we get additional data to test them?
1. Does IQ Change Over Time?
This one is debated. In my previous post I used the record-level data from Lynn’s database to look at some changes over time. But if you read folks like Cremieux , you’ll find enormously convoluted debates about this questions. The national IQ defenders seem ambivalent about this.
Flynn?
The Flynn effect (a phenomenon of purportedly rising IQs) comes up a lot, but Cremieux is a skeptic of it. He writes in a phenomenally long and complex article that I perhaps 35% understand the following:
The Flynn effect as a consistent 0.3 point-per-year increase in IQ scores has polluted the public’s understanding of intelligence research. It has enabled people to evade hard thinking about the whole research area because, after all, if IQs can change so rapidly, people must be as malleable as soft clay and any findings about IQ are thus ephemeral.
But the reality is messier; it doesn’t lend itself to sociopolitical conclusions because the form and nature of the Flynn effect is unclear because it’s not just one thing. It doesn’t seem to have made for a smarter globe, nor has it shrunken the differences between groups, because that’s not what it’s about.
Because the Flynn effect is such a heterogeneous phenomenon, I’m confident making one conclusion about it: It needs to remain in the realm of academic research, since all it does for the public is mislead.
So his view is that, once you correct for a huge range of super complicated biases in the data, there isn’t a secular increase in IQ.
And by the way, when I use the record-level data from Lynn’s database, which is all psychometric data that I am sort of optimistically assuming has been handled in the way Cremieux thinks is proper since he’s evidently very close with some of the relevant researchers, I indeed find no clear evidence of a Flynn effect (this is marginal mean global IQ from the record-level NIQ database using country fixed effects and categorical decades).
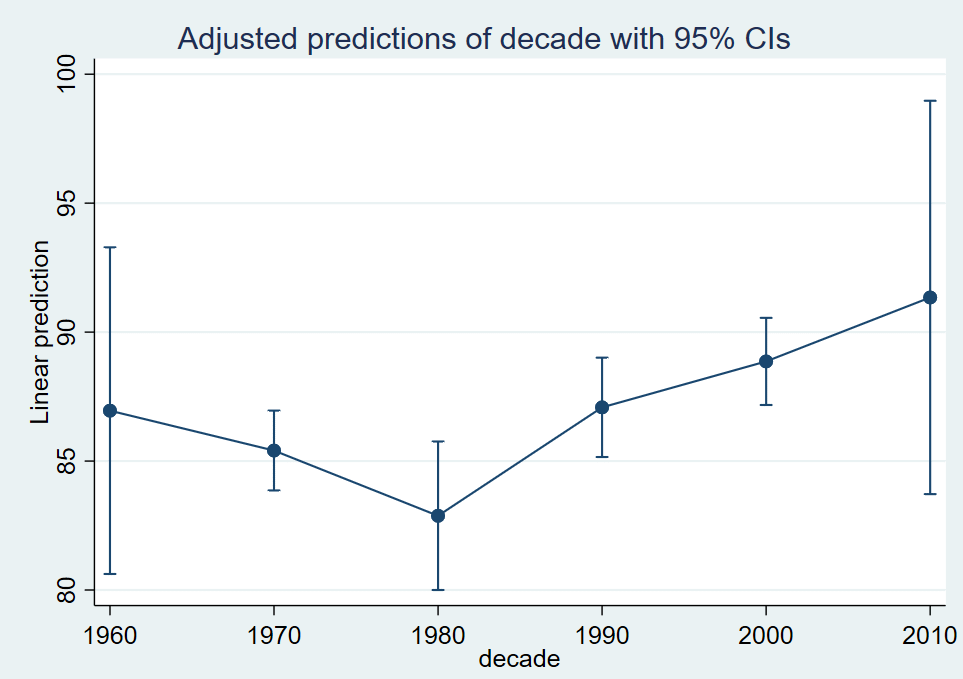
Taken at face value, within-country IQs tended to actually decline between 1960 and 1980, then rise 1980-2010, but the standard errors are such that this effect is not highly significant. Here are three possible candidates for “true” underlying time series (i.e. all points fall within the SEs shown), all of which give very different intuitions about a possible Flynn effect:
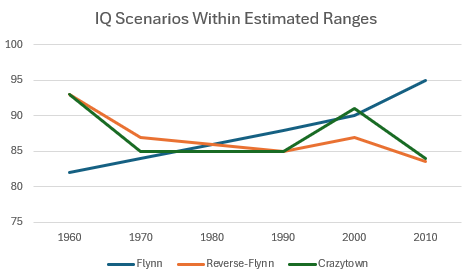
Any of those scenarios could have given rise to the actually-observed effects.
China?
But nonetheless, there are cases where folks like Cremieux seem to believe IQ did change over time. Take China. Cremieux produces this figure:
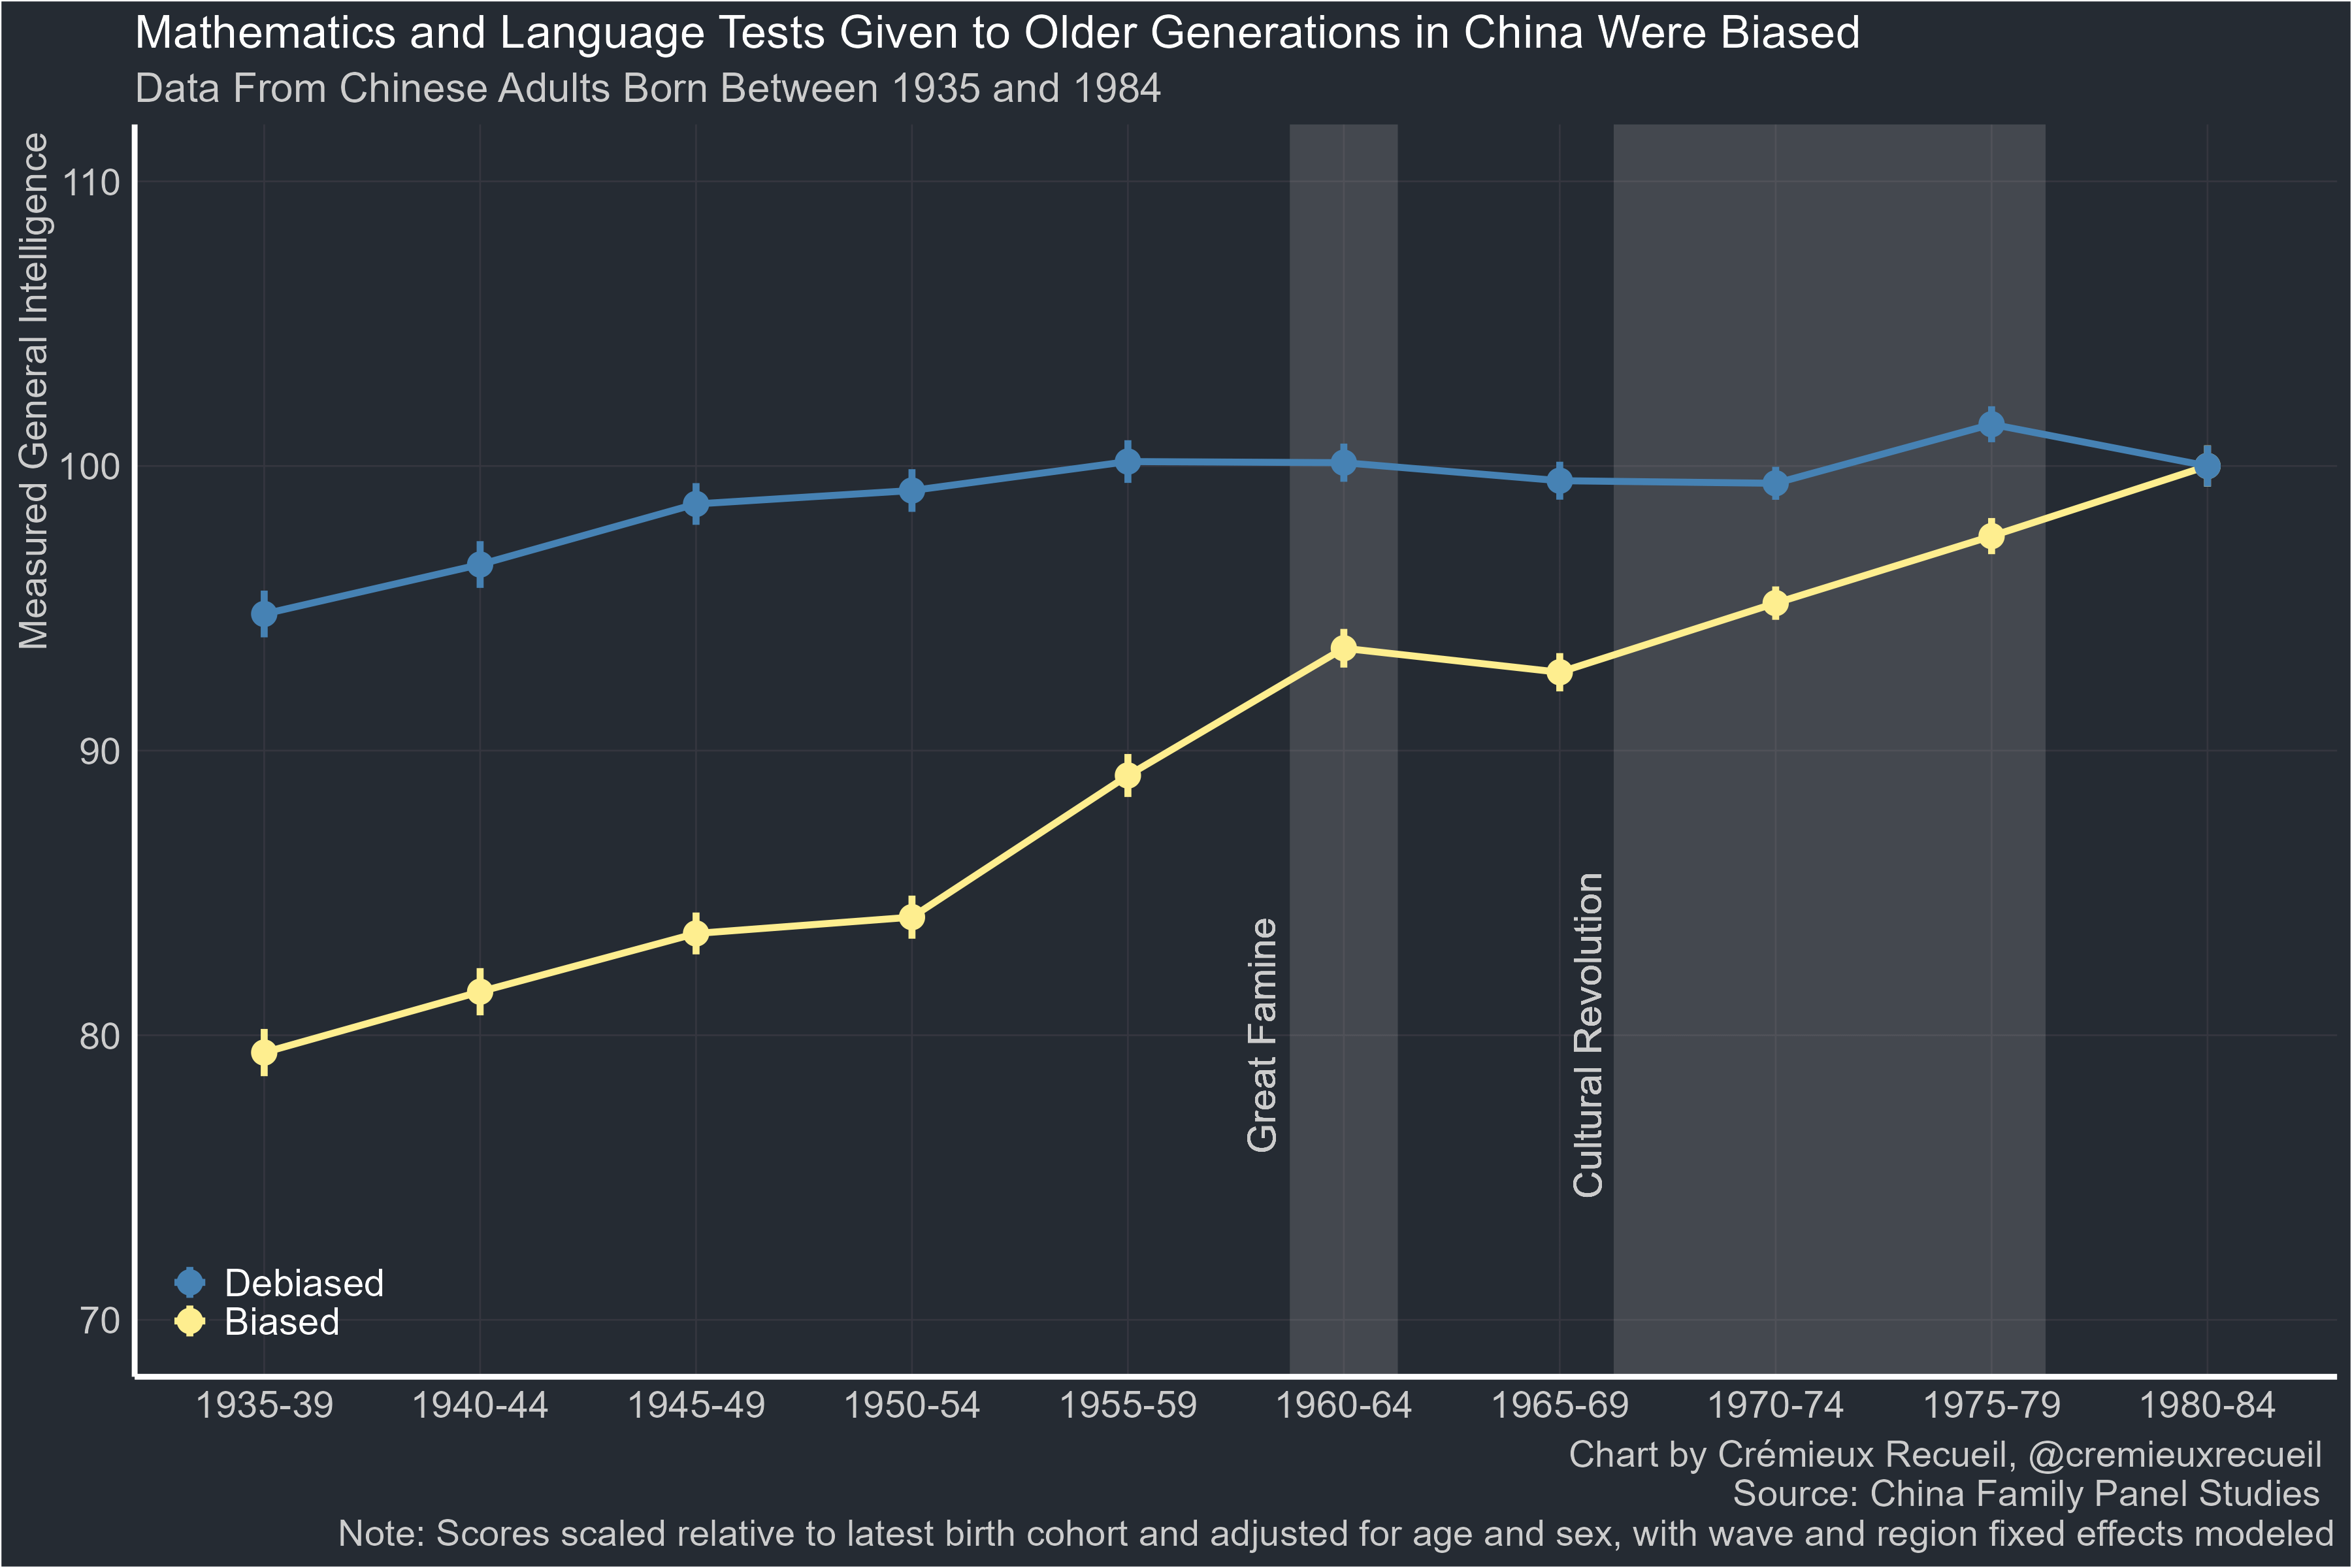
His point is that the yellow line is a very biased estimate, and also that nutrition didn’t seem to alter IQ much. That’s all fine by me.
But look at his debiased blue line! It still shows a change in IQ from ~95 to ~100 over the course of about 50 years 20 years from 1935-39 to 1955-59. 5 points in 20 years means about 0.25 points per year, very similar to the standard Flynn effect of 0.3 points per year which he debunked above. This is interesting, because the CFPS is a retrospective panel, we we know that higher-IQ people tend to live longer, so survivorship should have actually biased even Cremieux ‘s blue line upwards. The true IQs of the original schoolchild cohorts for e.g. 1935-39 are probably somewhere well above the yellow line, but slightly below the blue line, whereas the cohorts 1965 and later are probably correctly estimated.
So since we have a good idea of what Cremieux thinks the history of China’s IQ may look like, we can ask: what does the national IQ database show for Chinese societies vs. these estimates?
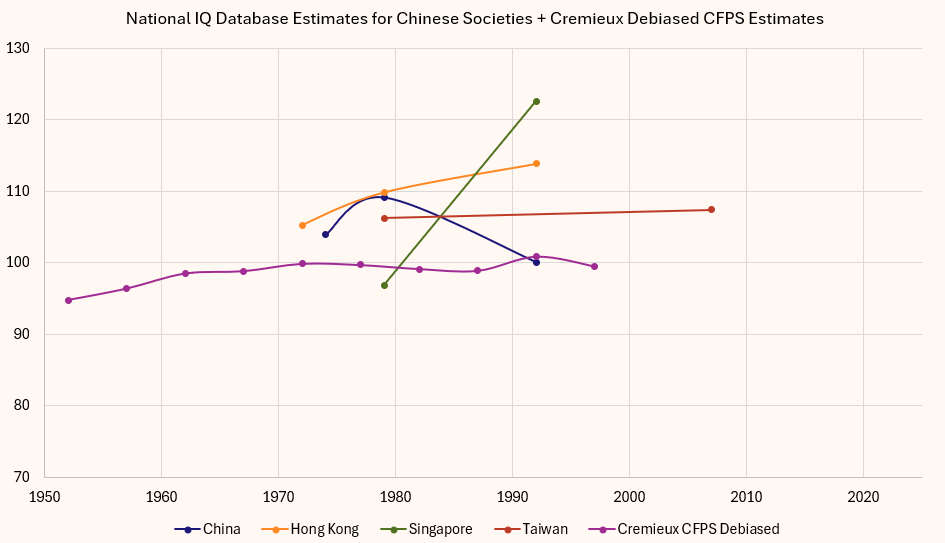
As you can see, there’s a pretty wide range here! Hong Kong rose from 105 to 114. Singapore rose from 97 to 123. Taiwan was about stable at 106 or so. China in the national IQ database rose in the 70s, then fell. In Cremieux’s data (which I have aligned to years the birth cohorts turned 15), it rose in the 50s and 60s and has been stable since.
So there are two options here. One option is that there is just absolutely gobsmacking error margins on national IQ measures. Even if we limit to China proper and exclude HK/SG/TW, either we have considerable changes in Chinese IQ over fairly short windows, or we have very large measurement variance.
I’m a fertility and demography specialist. As part of my for-profit work, I forecast births in China for companies that sell stuff for moms and babies in China. Chinese fertility statistics are notoriously unreliable. They are widely considered to be so error-prone and debatable as to be virtually useless (which makes my forecasting job, uh, interesting). So let’s ask, in a field totally unrelated to IQ, what level of variation in Chinese data is enough to make experts literally argue that the Chinese government is perpetrating massive fraud?
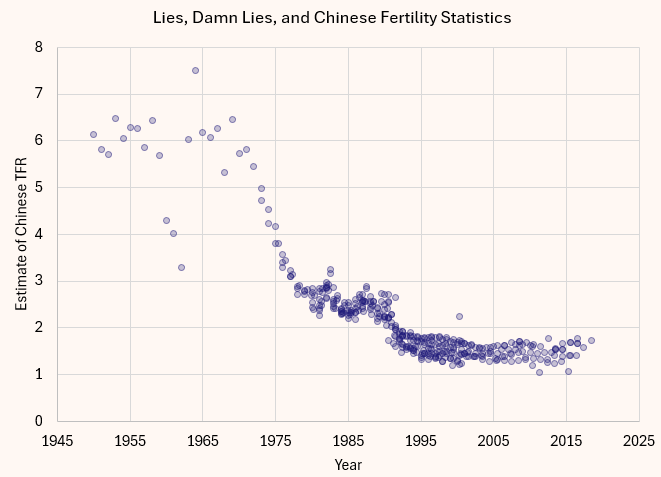
We have 776 point estimates of Chinese fertility. The entire NIQ database has fewer than 700 point estimates for the entire planet. The 776 Chinese points have plenty of disagreement in them, but seriously look at that graph, the broad contours of Chinese TFR trends over time are just not even remotely in dispute. And even there, demographers look at this data and say, “Ah, so it’s complete crap and hardly even something we can analyze at the macro level.” And note that those huge TFR drops around 1960 in China… are not measurement error! TFR plummeted during the Chinese famine! And the big anomalous increases you see? Are… sometimes error, but sometimes Dragon Years!
But maybe this is cheating: IQ is basically a survey-respondent topic, whereas TFR is a meatspace reality with a papertrail.
So let’s ask, “What does Chinese desired family size look like over time?” Here are a bunch of estimates we have on that question:
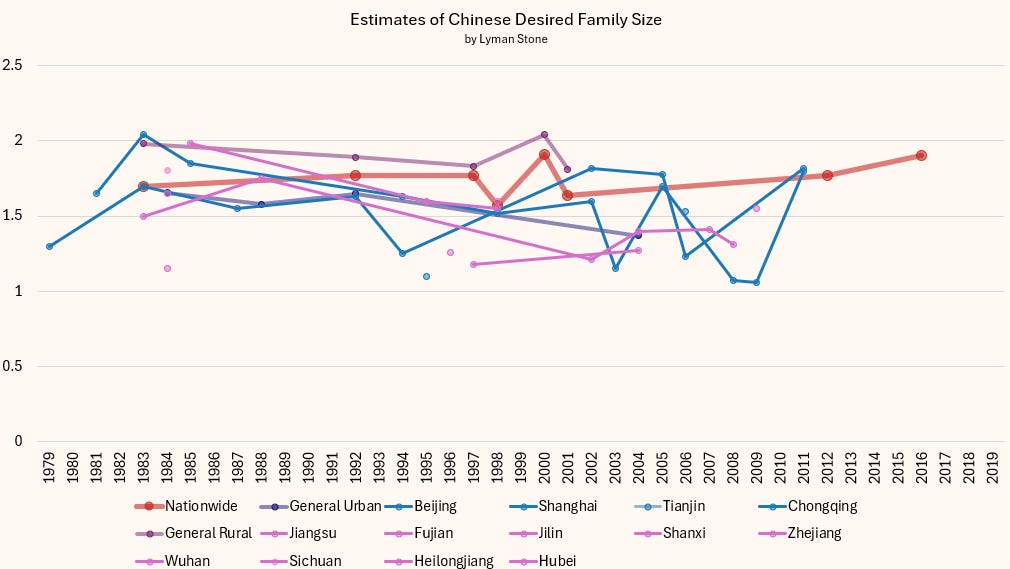
What I want to note here is I have not made any effort at all to harmonize this data, such as by e.g. separating out intended vs. desired vs. ideal family sizes, even though these obviously aren’t the same thing. You can see the nationwide data is very stable over time around 1.5-1.8. There’s plenty more noise in the province-specific numbers, but the general rural figures are very stable, while the general urban figures show a pretty steady decline.
Now here’s the kicker: again, scholars of fertility preferences would regard this data as very low confidence. Why? China’s a totalitarian state that regulated fertility numbers and so we worry people may have lied about their preferences. But the point is, even when we have way more data (more sources, larger sample sizes, more controls, etc), most scholars in demography would look at the Chinese data and say “Not really good enough.”
And yet we’re supposed to believe that 3 psychometric datapoints and one panel study, which among them do not agree in level or in change over time, tell us something informative about Chinese IQ?
I think not.
Ireland?
I appreciate Cremieux highlighting the case of Ireland. A prior study has done a very deep dive into Irish IQs over time. Cremieux shows this graph, which purports to tell us that Irish IQ has not changed:
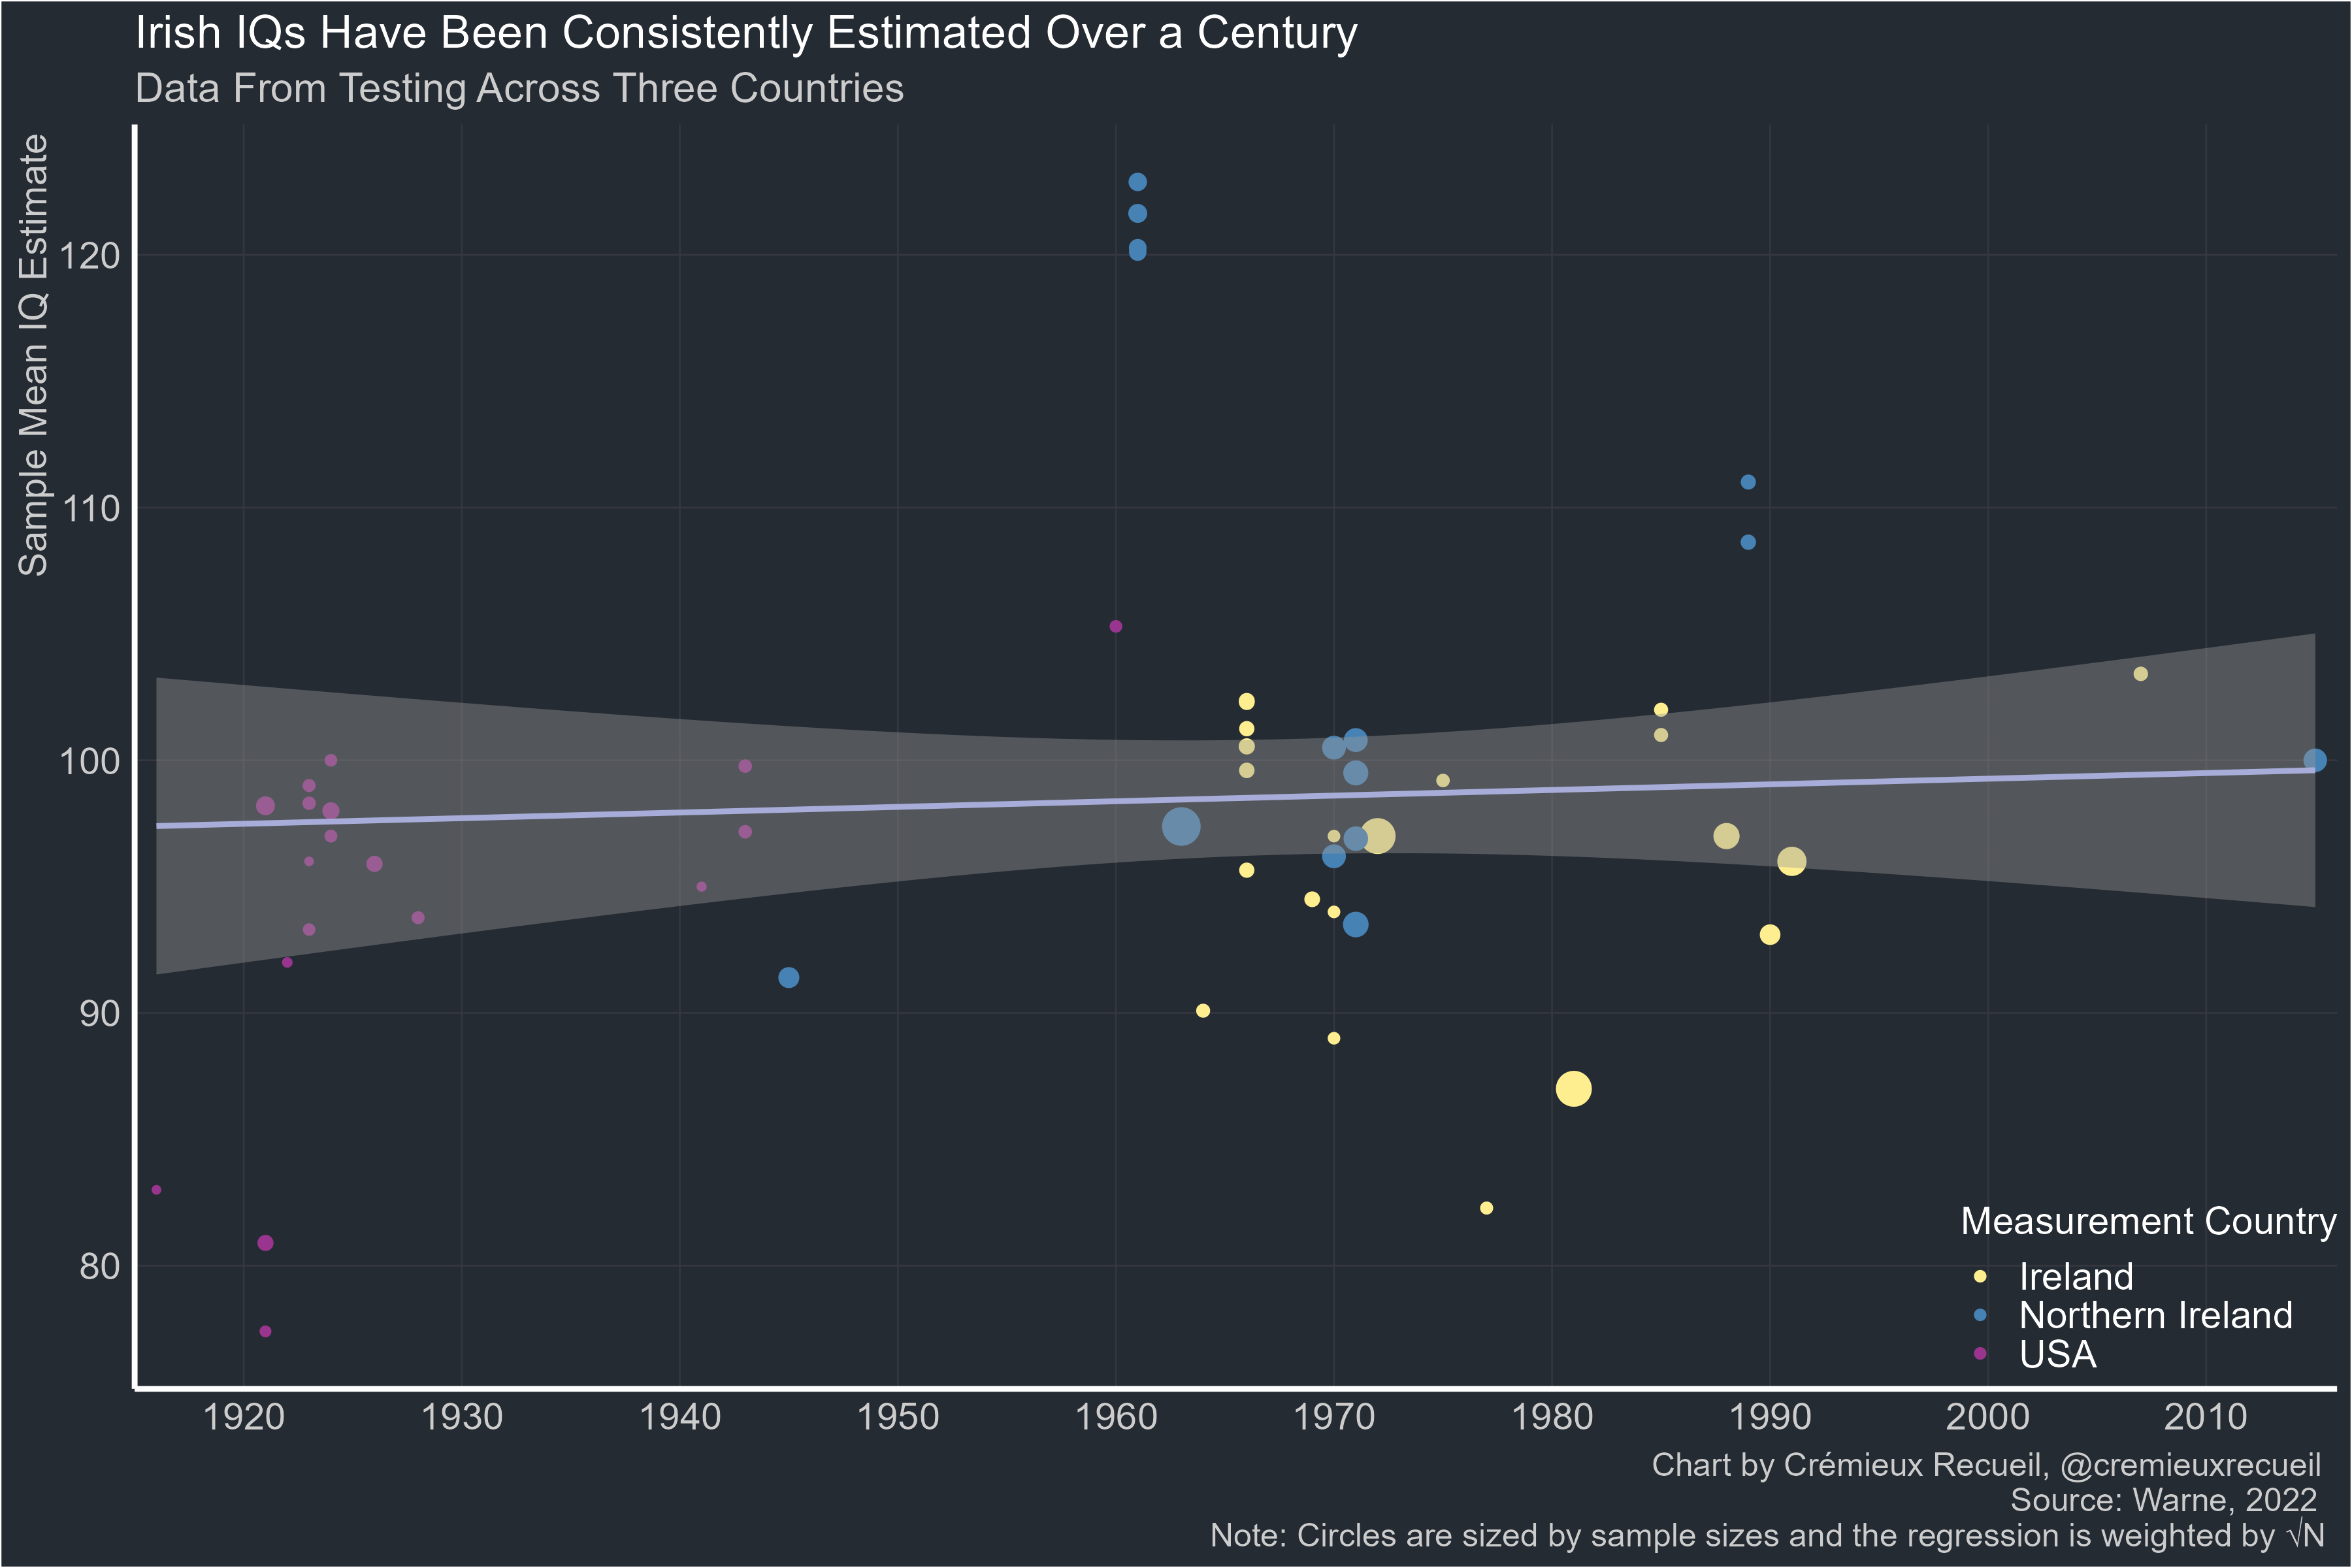
But… is that what it really shows?? The immediate thing that stands out is that Cremieux chose to use a linear regression for a series that simply might not be linear. Here’s a Lowess smoothed graph, but unweighted, which is goofy since some of these samples are much bigger than others:
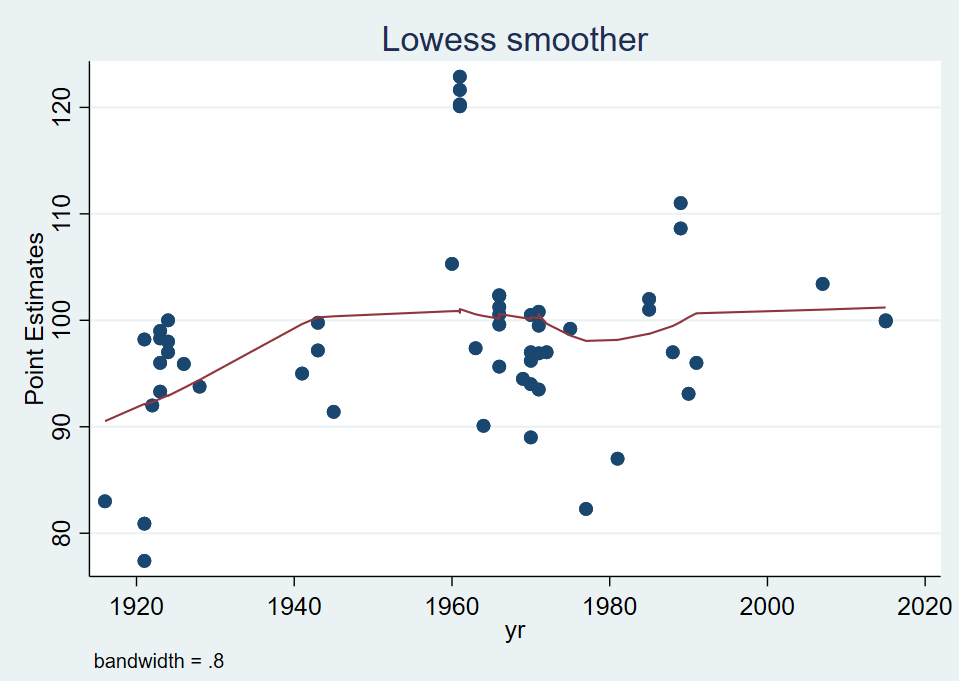
But we can do better. Let’s do some cleaning. We will pool results by decade, though since there are just 3 estimates since 2000, we will pool the 2000s and 2010s. Likewise, the single pre-1920 estimate will be pooled into the 1920s. Also, we are going to drop those super high estimates in 1961 (they’re from a finishing exam of high school graduates, which obviously in Ireland in 1961 is massively positively selected). All the other estimates look like they may be within some plausible-ish range.
Here’s estimated Irish-ancestry IQ by decade:
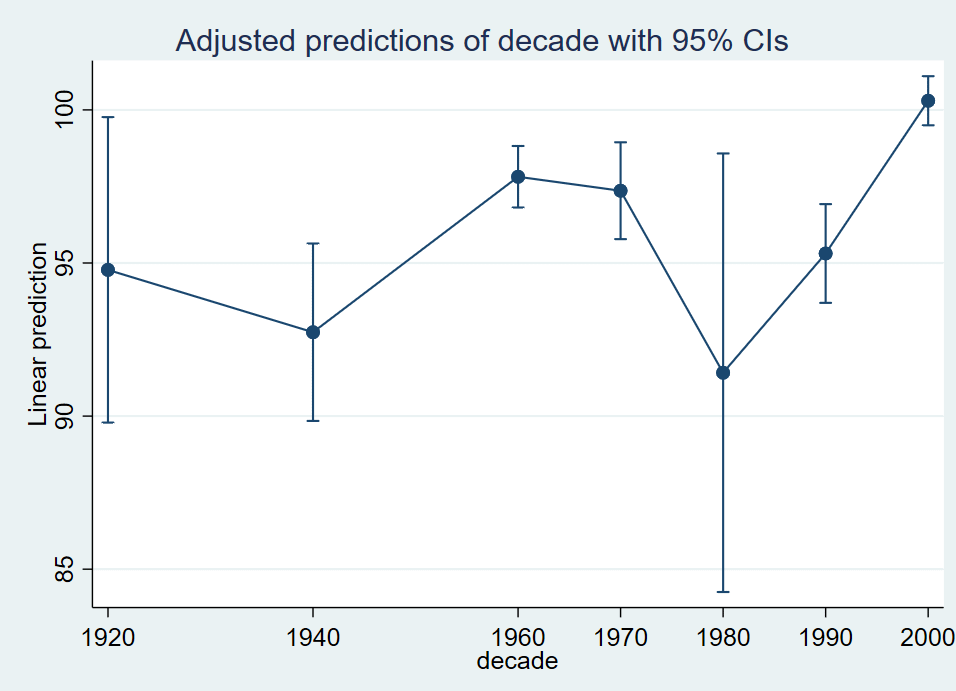
With the exception of the extremely high-variance 1980s, it sure looks like the 2000s have higher IQ than any prior period of Irish history.
What if we compress more? We’ll do “pre-WWII,” “WWII-2000,” and “since 2000.”
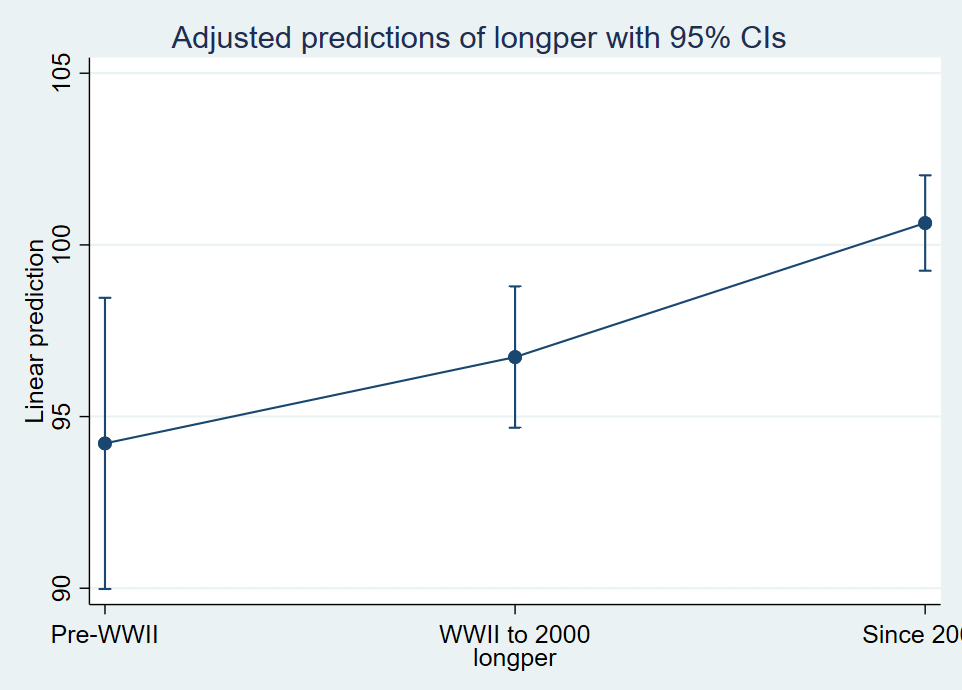
Well. How about that. It looks like a long-run change in Irish IQ.
So, did Irish IQ change? I mean… it sure looks like it?
If that’s not a real change, then, again, we have to conclude that these IQ measures are just mind-blowingly unreliable!
Norway!
We have good data on Norwegian IQ from large samples for a long time. I’ve seen Cremieux cite exactly this paper favorably, so I’m assuming he thinks it’s credible. Here’s Norwegian IQ over time:
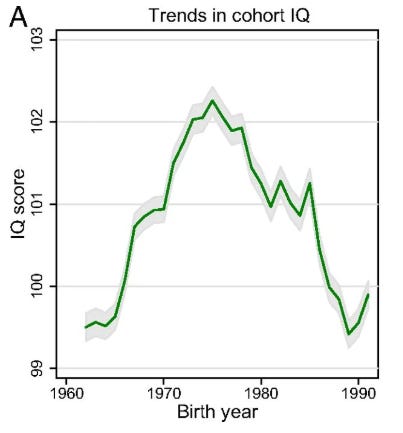
IQ rose approximately 2.5 points between the early-1960s birth cohort and the mid-1970s cohort, consistent with a Flynn effect of perhaps 0.2 points per year. But then it crashed again.
Now, Cremieux could very fairly say that these are really small changes. The differences between Africa and Norway are much more than 2.5 points in the NIQ databases.
But in the latest effort to estimate national IQs (which I’ll come to shortly), the estimate for Norway has an SE of 0.7 points. For countries with a mean estimate under 80, the average SE was 3.9 points. Now even at 95% confidence, you still wouldn’t close the Norway-Africa gap with those SEs. But that doesn’t matter; the point is that in countries where we have precise data, we in fact find nontrivial changes in IQ over time. This especially matters since the environment for Norwegians graduating high school and taking a cognitive ability test around 1980 (the starting point of the above graph) just was not that different for those graduating and taking an ability test around 1990-1995. Norwegian environmental differences across those cohorts are trivially small compared to the environmental differences between Norway and Africa, or African teens in the 1960s vs. African teens today.
All in all, the evidence seems to suggest that IQ estimates do change over time, but, hey, maybe it’s just massive measurement error!
2. If IQ does not change over time, why do estimates of IQ change so much over time?
But let’s assume that in fact IQ is basically invariant over time for countries. Here’s what IQ measures look like for all countries with measures in at least 3 years (in 2 graphs to reduce clutter):
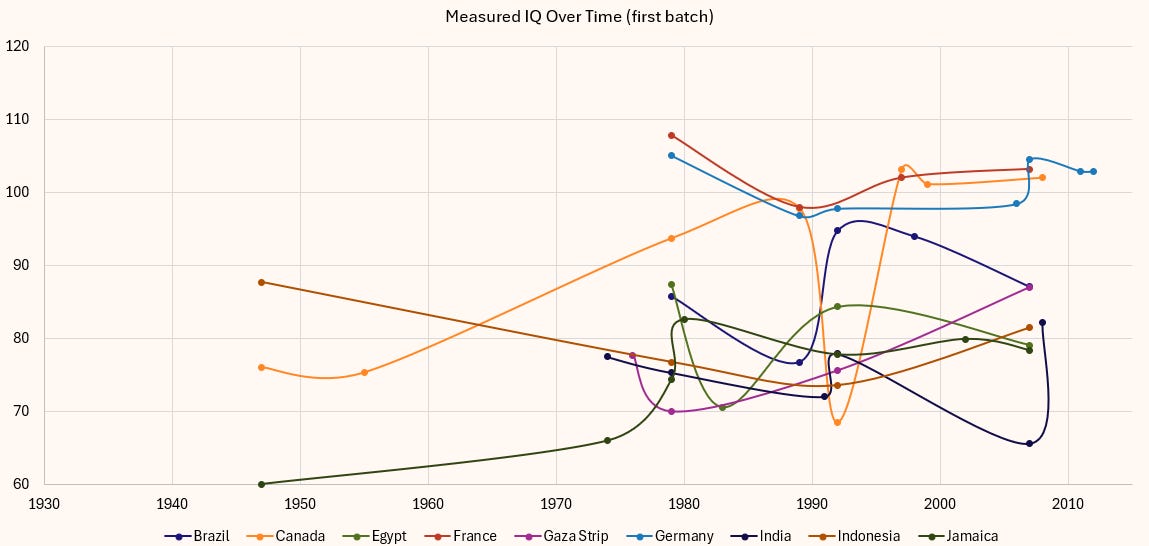
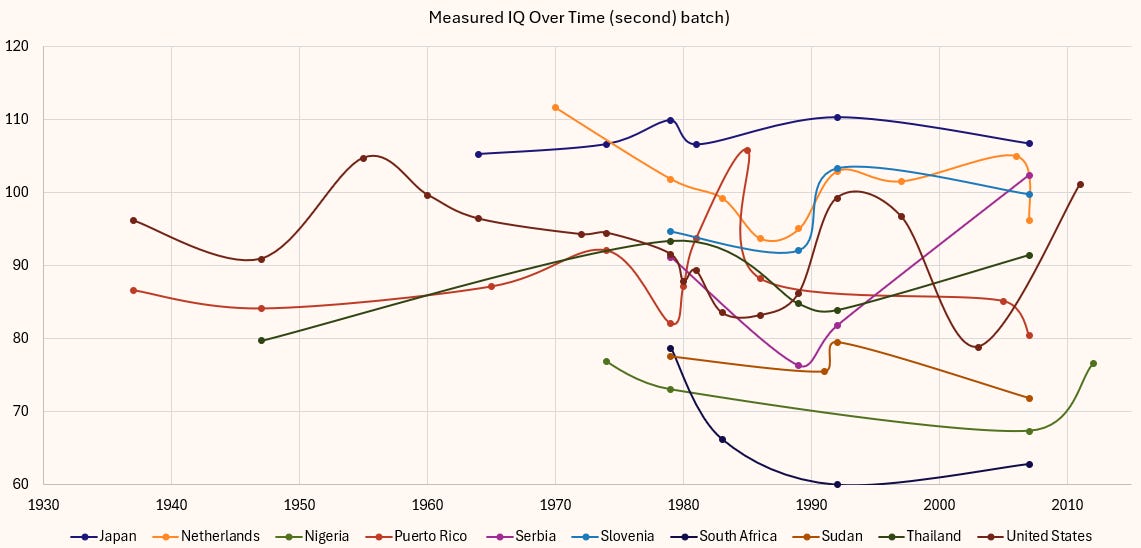
As you can see, IQ estimates are really unstable! They’re all over the place!
Now maybe Cremieux can say something like, “Well, you have to do some extra normalization…” or “Well, the samples aren’t all quite representative, so you have to do some adjustment…”
Okay, fine. Do those and come back. I’m using the NIQ data downloaded right off the site that hosts Lynn’s data, the latest, most updated version. I made no special modifcations. And it sure looks to me like those estimates are bologna.
And we can see how the bologna gets made in the file of NIQ data. Here’s the U.S.:
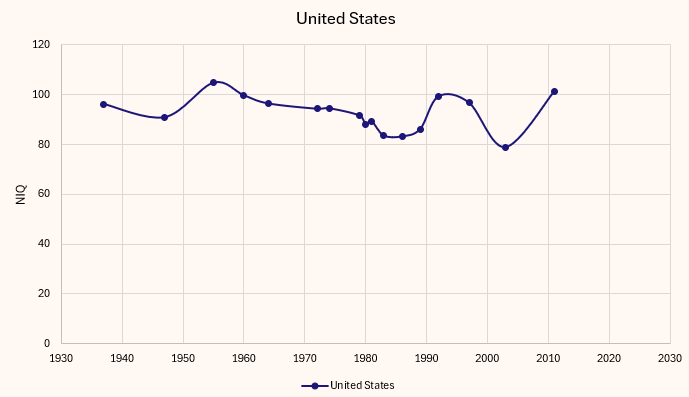
Did U.S. IQ fall massively between 1998 and 2003? Obviously no. What happened is the 2003 sample is only of 176 Native American students referred for testing, while the 1997 sample is a sample of 582 non-randomly selected twins. You can decide for yourself if you trust either of those samples. Personally, I do not.
Now, you may wonder how these clearly incomparable samples get turned into a national estimate. Answer: weighted averaging by sample size. That’s it. That’s the method. If it so happened that whites or blacks were over-sampled, there’s no effort to correct for deviation from actual population mixes. This method is obviously absurd and makes no sense.
So, a big reason national IQ estimates seem to change so much over time at the record level is because the underlying data is a shotgun blast of completely incomparable data sources that are then crudely averaged together by sample size to yield national estimates. You can download the data file and follow the Excel formulas yourself to verify all of this.
I highlighted the case of Cambodia in my prior post. Let’s revisit Cambodia:
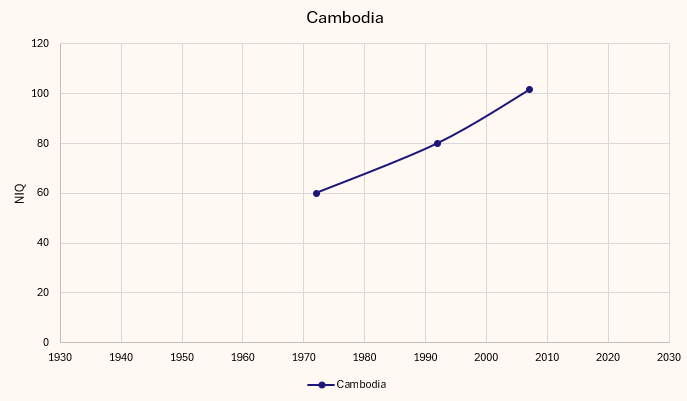
Here’s metadata on those datapoints:

First of all, you can see that these are not, in fact, surveys of Cambodia. These are surveys of Phnom Penh.
Second, notice that the first two samples were of university students, but rather low, even as the last sample, with the highest IQ, was of children generally. This is, to be frank, bizarre. This strongly suggests that, if we had a university student sample for the 2007 data, it would be even higher suggesting that, if anything, we are underestimating the pace of IQ change in Cambodia.
Third, I didn’t mention this before, but I’m organizing IQ estimates by birth cohort. So we’re looking at kids born around 1973, or born around 1992, or born around 2007. I did make an error here in my last post as I mentioned the Khmer Rouge fell between the first two cohorts. It still kinda-sorta did: it fall in the childhoods of the 1973-born cohort but not the 1992-born cohort. And here this actually could support some kind of selection argument: college students born in 1973 in Cambodia had rather low measured IQs, perhaps because the Khmer Rouge had killed off all the intellectuals, and so the cream of the crop in Cambodia nonetheless had low IQs.
But then you immediately would have to abandon a hereditary argument, since the college students born around 1992 are the next generation. If national IQs were around 60 for the 1973-born cohort, there really is no way any degree of heredity selection could get you to 80 just 20 years later. That’s a whole IQ point each year!
So, Cambodian IQ must have rocketed upwards! If university students in Cambodia in 1972 had an average IQ of 60, surely the general population had an IQ of <55, meaning extremely large shares had IQs in the 30s. That kind of epic dysfunction should show up.
And that leads us to our next question…
3. If IQ does change over time, why don’t observed changes correctly predict economic growth?
If we align each Cambodian cohort by when they turned 22 and were plausibly fully integrated into the labor force, the 1973 cohort is 1995, the 1993 cohort is 2015, and the 2007 cohort is 2029. What was the growth rate around those periods?
Per capita inflation-adjusted purchasing power parity in Cambodia grew 29% 1995-2000, that is, in the period when the university students of Cambodia then-entering the labor market supposedly had an IQ of 60.
The same economic measure grew 20% (so, less!) 2015-2020, that is, in the period when the university students of Cambodia then-entering the labor market supposedly had an IQ of 80.
The 2007 cohort won’t enter into this comparison until 2029. But here’s 5-year growth rates over time:
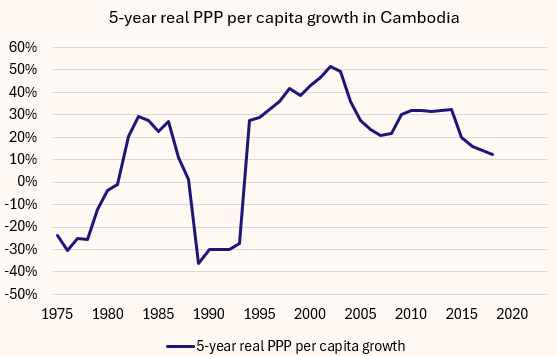
They are trending down, not up, even though Cambodian children born around 2007 had 20 points higher IQ than Cambodian university students born around 1993, and 40 points higher than Cambodian university students born around 1973.
I gave lots of panel regression evidence in the previous post.
But here I’ll say: I think the NIQ-fan crowd really have an obligation to produce something they see as temporal estimates of NIQ. Right now, they exclusively produce estimates which average values across tons of different time periods. They need to produce their best effort at time-varying estimates and put it in a database we can all test.
If we use the Irish IQ estimates mentioned before:
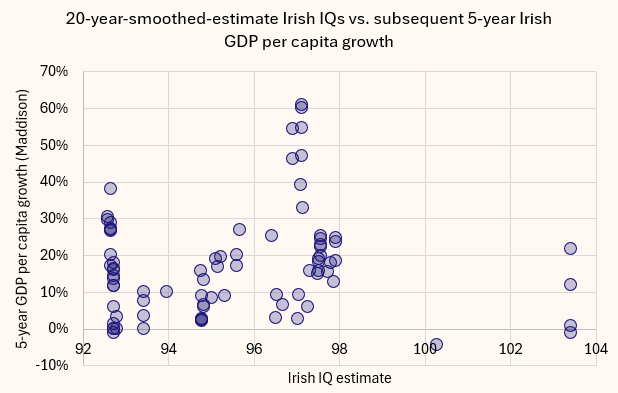
It’s clear that Irish GDP per capita growth has actually slowed down in the period with higher IQ.
If we use Cremieux ‘s debiased Chinese estimates:
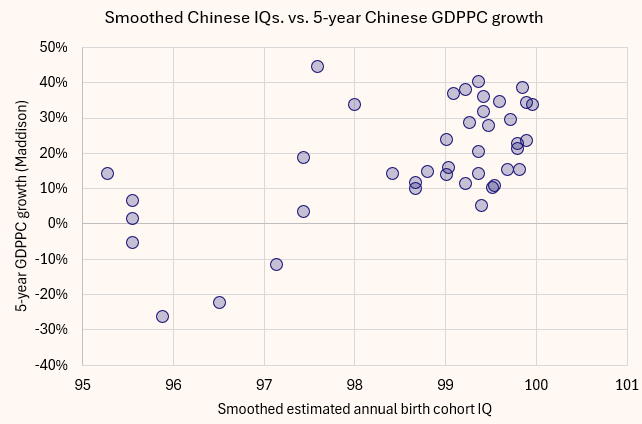
This one actually does look slightly plausibly positive: Chinese working-age cohorts with higher IQs did experience more growth.
But the effect size of course is insane: there’s no way the shift from IQ=96 to IQ=99 would cause a change in GDP growth from -10% over 5 years to +20% over 5 years. Nobody believes that.
Now, here, I want to acknowledge that Cremieux is correct that static national IQ estimates do have some useful predictive value for GDP growth. But that’s just the problem! Static national IQ estimates shouldn’t predict growth! If a society has higher IQ from the get-go, then they should have been wealthier earlier on anyways! Modern growth should not vary by some static IQ variable! At a minimum, the heritable component of IQ really shouldn’t predict growth. Yes, smarter people may innovate more, adding more value in period t+1, but their ancestors were also already smarter and innovated more in t-1, creating a larger economy at t=0, such that the actual rate of growth shouldn’t vary very much!
For higher IQ to boost growth rates, you’d need to tell a story wherein the degree of productivity increases gained by an extra IQ point rose markedly in the study period (1960-1996) vs. say 1800-1960. But I cannot fathom why you would believe that story: we know that IQ point differences of just 2-10 points were associated with massive genetic selection events that led to entire Y chromosomal lineages being exterminated from huge swathes of Neolithic Europe. There was not a sea-change in economic growth rates 1960-1996 vs. an earlier period.
To make their case, the national IQ-fans need to produce a database presenting what they view to be credible estimates of the IQ of the working-age population for a wide range of countries and years, so that we can observe how changes in that value do or do not associate with changes in growth.
4. Do countries with low estimated mean IQs still have approximately normal IQ distributions around those means?
This is I suppose just a clarification question. But when somebody says “The IQ of a country is 102,” I assume they mean 102, with a standard deviation of 15 points, because conventionally IQ has a standard deviation of 15 points.
But does that hold when a country’s IQ is estimate at 65? Because if so, shockingly large shares of people would have IQs in the 20s, 30s, and 40s. IQs that low are not just going to have a bit less numeracy and poor abstract reasoning. People with those IQs even without other idiopathic sources of low IQ are disabled. They do not create social worlds. They are constantly dependent on others. They are exceptionally rare in well-studied populations in the West: almost all such extremely low IQs are due to some kind of profoundly disabling conditions. But if low-estimated-IQ countries have approximately normal distributions of IQ with similar SDs as high-estimated-IQ countries, then a whole lot of people there must have non-idiopathic extremely low IQs, and I just am not remotely convinced of that. Conventional estimates from Sub-Saharan Africa do imply elevated rates of cognitive disability, but not nearly enough to account for some normal rate of abnormal genetic issues + elevated bad environmental causes of low IQ + astonishingly high rates of extremely low IQ for general genetic reasons. Some back of the envelope math suggests estimated rates of cognitive disability are 20-50% too low in Africa to for this math to work out.
Relatedly: if environmental causes explain some low IQ measures in Africa, what effect should we expect that to have on distributions? Environmental causes are likely to be highly idiosyncratic rather than “everybody is reduced by one point.” So shouldn’t we expect distributions in Africa to be wider than in other societies, with more low-end clustering of people who are functionally disabled?
Keep reading with a 7-day free trial
Subscribe to Lyman Stone to keep reading this post and get 7 days of free access to the full post archives.