

Why IQ Research Doesn't Publish Well
Everything correlates with everything, and so Reviewer 2 is actually correct: you really do need to have strong a priori reasons to believe your inputs are credible

This post is ostensibly about IQ stuff since that’s topical right now, but I could as easily just write it about demography. It applies generally. What we’re going to do is talk about correlation, causality, and what makes for a trustworthy research finding.
This is a longish post, but I have made it all free, because the people it addresses whined about my other posts having modest paywalls at the end, on a website literally designed to distribute paid content. Whatever.
The simple thesis here is this: the hereditarian IQ researchers are very intelligent psychometricians who feel persecuted and excluded from academia. They are partly justified in this since journal editors and reviewers actively loathe them for at least two reasons, first and foremost, because they are popular, secondly and definitely less important of a reason why academics dislike them, because their ideas seem to be rather racist. However, there is a third reason IQ research is often hard to take very seriously in many journals: because a lot of it may be fine social psychological research or psychometric research, but it is susceptible to well known problems that bedevil a lot of social science research. IQ research used to be publishable, before academic became a lot more woke (so racism more badder), more sensitive about status (so popularity more threatening), but especially since social science started to care about causality and correct identification. Below I’ll focus on one of the many significant theoretical reasons you should be skeptical of national IQ data.
Everything correlates with everything
Here’s an extremely powerful correlation:

When Neptune and Mercury are closer together, Azeris consume less oil.
Here’s another one:

When more people get BAs in public administration, there are more gas plant operators in Alabama.
These correlations are extremely strong. They are also totally worthless.
Those correlations come from a site which randomly produces absurd correlations. But in 2021, national news media covered a story saying that Zodiacal signs predict vaccination rates.

I could go on. Spurious correlations are everywhere.
The reason is simple. Think about how random chance works. Start with dice. You roll a die, you have 1/6 chance of getting a 6. Roll again, still 1/6. If it’s a 1d20, you have a 1/20 chance of rolling a 20. If you had a 1d1000, you’d very rarely roll a 1000!
So extreme events feel rare. But they actually are very common. Why?
Because the universe flips a coin every 10^-43 seconds, a unit of time called “Planck time.” Basically, this is the unit of time on which the random probabilistic foam underlying the universe resolves in some way. Physicists just cried out in pain at what I said there, but the basic point is that, yes, the universe is making probabilistic draws at a massive frequency. Flipping a coin and getting 1,000 heads in a row may seem super implausible, but given how often the universe flips a coin, it actually does happen! This is why David Hume is basically right: we really cannot infer causality from any strength of correlation or correspondence, because extremely strong extremely bizarre correlations are actually very, very common. Rather, we have to infer causality from some kind of bizarre philosophical leap into mechanics. We make these leaps all the time, and in academia we call them theories. You need a theory which is prima facie persuasive, and then you need evidence to back it up.
Now think about Utah vaccination rates. There are a lot of “random” ways to divide people. Zodiac sign. Chinese zodiac sign. Day of week of birth. Whether date of birth is prime or non-prime. Alphabetical order of first name. Alphabetical order of last name. Once you start to think about it, you realize that you’re likely to have a lot of options about which random draw to make.
And are these draws even random? No: Zodiac sign is month of birth. More-and-less educated people have different seasonalities of birth. Different races have different seasonalities of birth. People at different elevations have different seasonalities of birth. What month you were born actually isn’t totally random. Births also spike/drop around policy thresholds related to schooling, insurance, and taxes! If I know your month of birth, I can have better-than-random odds at guessing a lot of facts about you even at birth. And since schooling cohort and lots of other life outcomes also sort by month of birth, birth month really isn’t random. This isn’t because Zodiacal signs really cause stuff, it’s because other stuff shapes birth timing.
But you don’t need to think about all the reasons why month of birth could explain vaccination rates. Rather, all you have to do is ask, “What is the theory explaining why Zodiac signs influence vaccination rates?” and if it seems like hocus pocus, you really don’t have to waste time looking further. The number of correlations is infinite, we have to make strong theory-informed arguments for why a particular one should be taken seriously.
In the case of COVID vaccines, by the way, it actually turns out that the Utah data wasn’t representative: Zodiac sign does not predict vaccination rates.
Sometimes, the reason you find strong correlations is because the data sucks.
This is important to understand. Errors in data, or errors in data use, are not usually random. Errors are in fact usually biased: one side of the distribution was undersampled for systematic reasons, a coding error or data transformation systematically shifted means or variances, some underlying nonrandom data-generating-process was ignored, etc. The point is, apparent correlations are a lot less persuasive than you think they are. Your brain desperately wants to correlate stuff, correlations feel good, they feel persuasive: they often mislead. They are common, random, and often errors bias in favor of correlation, rather than against (this is true even for accidental errors; but it’s especially true of all-too-common researcher degrees of freedom and academic fraud).
Example: Cousin Marriage
This problem matters a lot! For example: a lot of people notice that Western Europe got richer before Eastern Europe. A lot of people also notice that Western Europe had a distinctive marriage pattern vs. Eastern Europe, especially, lower rates of cousin marriage. A lot of people also notice that the Catholic Church worked to suppress cousin marriage after 1000 AD, and that after 1000 AD seems like when Western Europe started to get richer than Eastern Europe. As such, many people suppose that cousin marriage has very bad effects on economic growth, and Western suppression of cousin marriage may have caused Western European economic takeoff.
Problem: new research argues that cousin marriage was already lower in Western Europe than in Eastern Europe before the Church suppressed it! It proposes that anti-cousin-marriage was an ancient norm of the pre-Neolithic peoples of Europe, and that subsequent expansions first of Neolithic Farmers then of Steppe Pastoralists into Europe spread cousin marriage. That’s the story.
But guess what? That’s wrong too! We now have an extensive genetic reconstruction of one of those Steppe Pastoralist invading groups (Avars) showing extremely LOW rates of cousin marriage! So it’s probably wrong that cousin marriage was brought into Europe by subsequent migratory waves from the Steppe.
What about the European Neolithic Farmers? Well, genetic data seems to suggest that European hunter gatherers had more cousin marriage than European Neolithic Farmers (purple dots are hunter-gatherers, blue dots are agriculturalists, yellow dots are pastoralists):
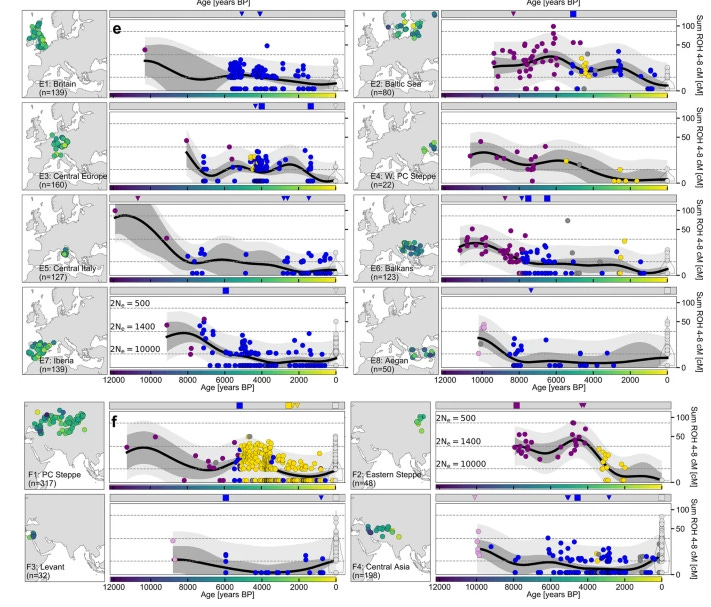
Everywhere we look, cousin marriage is a feature of hunter-gatherers, non-kin marriage is more common for agriculturalists, and pastoralists are (probably?) in between.
So this tells us that actually there’s just no Western European historically deep unique cousin-marriage pattern at all. (Edit: after publishing I found this very cool paper which studies over 200 premodern European rural population databases and finds that the Western European Marriage Pattern almost never appears in its “pure” form anywhere in Western Europe, and indeed the only places that closely correspond to the “family systems” type generalizations are in eastern Europe!) It just isn’t there. When we look at ancient DNA, there’s no meaningful difference between agriculturalists around Europe.
That said, the spread of Islam in the Levant and Central Asia is correlated with rising cousin marriage, and we can even see this is the highly-controlled case of Socotra. And it should be noted is that the other thing Eastern Europe had more of… was exposure to Islam! The Ottomans ruled much of southeast Europe, the Golden Horde and the Tatars ruled much of Ukraine and southern Russia, etc, etc. The highest rates of cousin marriage in Western Europe are… in Andalusia and Sicily! Two places with heavy Islamic influence in the Medieval period! To me, the most plausible story seems to basically be that the specific cultural influence of Islam managed to create a norm of cousin marriage in Islamic societies and probably also non-Islamic societies geographically proximate to the Islamic world, in which case there’s no deeply unique European pattern at all: there’s a deeply unique Islamic pattern.
What’s my point here?
Well, if it turns out that actually there really wasn’t much variation in cousin marriage after all, then the entire story about cousin marriage causing stuff just… vanishes (except insofar as maybe it causes the Muslim world to economically underperform over time? who knows?)
Incomplete and bad historic data about cousin marriage created big correlations on future economic outcomes… but were actually just bad data.
The basic fact you have to deal with is:
Humans perceive and model time as linear (ish)
Statistical models are (generally) linear(ish)
Most variables change over time and with time
Humans are strongly motivated to tell time-bound stories where events cause changes, even if this isn’t true.
Thus, we are likely to over-perceive time-related correlations that don’t really exist.
Example: National IQ Scores
What does this tell us about IQ?
Let’s take the best recent estimates of IQ: Jensen and Kierkegaard’s sample, and see how it performs over time:

The line has graph has two lines: in blue, year-specific correlations between the modern NIQ estimate and GDP per capita estimated for that year. In yellow, the number of countries included in that year’s sample.
At first blush, the correlation looks weird: stable in many periods, but there are some big “level shifts” at 1700 and 1950, and also some anomalous years of bigger samples + lower correlations in e.g. 1600, 1650, 1750, 1800, 1820, 1870, etc.
What’s going on here is simple:
In the historic data, whenever the sample size increases, the correlation decreases.
Let’s make some adjustments here. First, let’s assume the correlation in 1949 was actually the same as it was in 1950, and then assume the year-over-year estimated changes from 1800 to 1950 are correctly estimated. Before 1800, let’s only use the years with the bigger samples which give more credible estimates: 1600, 1650, 1700, 1750, and again let’s assume there wasn’t really a massive break 1699-1700.

Now we have no major trend breaks (except maybe 1700 itself), and the trend actually looks very very plausible! The correlation between GDP per capita “in a given year” and the correlation between IQ “measured approximately 1950-2020” got stronger until about 1990, then got weaker!
The average datapoint in the NIQ database is from children born around 1980-2000 or so. So let’s ask a new question:
How correlated was NIQ with some other variable we have a long timespan on, like population density?

You can see that IQ measured in the latter 20th century has a >0.2 correlation population density during the Roman Empire!
Amazing!
IQ travels back in time!
You can also see that once ata becomes higher frequency after 1800 or so, the correlation rises. It peaks in the latter 20th century, then falls.
What about literacy? Yes! Modern IQ predicts past literacy!

Now look, the IQ folks want to tell you these correlations are because NIQs are such a strong variable.
So let’s review:
Modern NIQs were moderately predictive of GDP per capita 1800-1950, then became extremely predictive of GDP per capita 1950-2000, and have since declined.
Modern NIQs have had more-or-less stable correlations with population density over time, except for a big bump around 1900-2000.
Modern NIQs have had more-or-less stable correlations with literacy over time, with a bump between 1900-1950.
So generally, modern NIQs predict social outcomes occurring centuries before they were measured, when most IQ scholars believe their values were different. (Note:
is interesting in this regard since he seems to be a Flynn-effect skeptic . But most NIQ-fans seem to believe IQs do change over time, and indeed one, , has published a very nice article where he estimates time-varying NIQs, though I’m not sure if he’s published outputs of his models anywhere. He doesn’t say it this way, but if you look at his graphs, you’ll see that NIQ estimates are very unstable over time. Below is a gallery of just the first few countries, you can see several obviously change over time.


Most IQ researchers seem to believe that measured IQ for Europeans in the 1800s or 1700s were probably <90 plausibly <80. But for the cross-country correlations I showed to be so stable, that means that low-IQ countries must have been like <50 or <40! You see the problem? This implies absolutely unfathomably low IQs in the historic period.
The only reason modern NIQ scores should be predictive of traits of human populations in 1500 is if you believe some combination of:
There has been no change in IQ over time (we know this is wrong in measured IQ data, thanks
! also, recent genetic evidence shows European genetically-predicted IQs have risen about 0.2-0.4 standard deviations since 1500! that’s enough to say “IQ changes over time,” but we don’t have data yet for non-European populations so we can’t say how it compares, and those 1-5 IQ points are not nearly enough to explain massive differences in societal traits)Environmental variation around the world has either been perfectly stable (this seems very unlikely)
Environmental variation has no effect on IQ (we know this is wrong)
So since none of the things that could explain the fact that NIQs from today after the Flynn effect manage to predict differences in social traits from centuries ago, we have to conclude that NIQs from today just aren’t telling us what we might think they’re telling us.
Maps Are Liars
Now, lest you think I’m picking on cousin marriage and NIQs… it turns out this is a very general problem. In economic research, scholars have been calling out these kinds of “surprisingly shallow” alleged “deep roots” for many years. It turns out, even in a discipline with pretty rigorous standards for identification, most spatial-historic published papers are not valid. This paper isn’t about NIQs or intelligence at all, but read this section in the intro and tell me that’s not actually about NIQs:

If you’re a smart person on the Internet, you know this phenomenon. Every map of the U.S. is just a map of population density. Every map of Italy is the same map. Every map of Poland is the same map. The world is full of tons of these deep fissures that that map so neatly onto various historic events, and yet which turn out to defy easy explanation. NIQs may be like that. And while some NIQ-fans will say “Not it’s all really just proxying for IQ” again, we know that’s unlikely, because we know that NIQ’s change over time, yet current NIQs explain past differences when they shouldn’t have since they weren’t the same back then.
Some Additional Notes
wrote a reply to my previous post on NIQs. He frames it as a defense of NIQs, but here are some places I want to make some replies:How stable is dysgenesis?
He says:
So he agrees that observed dysgenesis in low-income countries is due to their current face of demographic change, not a long-run trait. Heres’ what I had said:
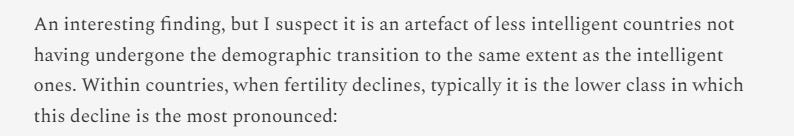
In fact, it’s widely known among demographers that fertility is becoming less-and-less negatively, and in some places positively correlated with educational attainment!
The ephemeral negative correlation between fertility and educational attainment is because of the class-biased spread of developmental idealism.
Early adopters of developmental idealism tend to be high-status. So high-status fertility falls first. Then low-status groups catch up, and eventually the human evolutionary norm re-establishes itself. This process takes a few generations. Right now, a lot of low-and-middle-income countries are at the bottom of the U-shape. This process will right itself. No need to wet your pants.
He’s agreeing that I’m correct but is uncomfortable with the implications I make, so framing it as disagreement.
We agree!
Cognition gradients in fertility outcomes are transitory, hard to predict, and likely features of unique historic phases!
Math fail?
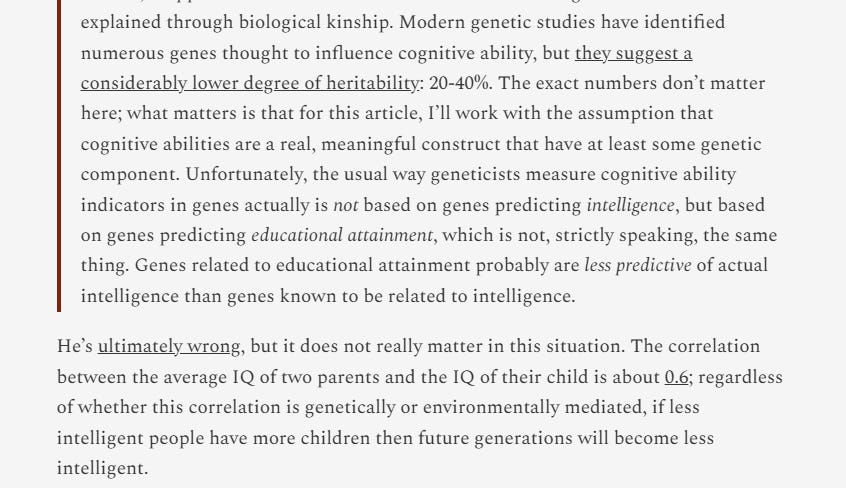
He says the correlation is 0.6. I say heritability of 20-40%. Conveniently, correlation squared is variance explained which (is not exactly but) is an extremely good proxy for heritability. 0.6^2=0.36, and 0.36 is between 0.2 and 0.4.
Again, he really, really wants to sound like he’s disagreeing with me, while agreeing with me.
Which gets us to:

He admits that he basically agrees that I’m right, but, as we will see, he just sort of dislikes me, so wants to find a way to make it sound like I’m wrong, even if he agrees with me.
HRS and PGS
We have a simple disagreement on how to interpret the EAPGS data from HRS. I prefer Beauchamp’s simple “What difference in children ever born is predicted by 1 SD change in EAPGS?” He prefers a much more complex regression-on-regression approach, matching coefficients on scores across groups instead of just regressing children ever born in EAPGS. But I think for selection, you really do want the simple, “How many more/fewer kids do people with higher/lower EAPGS have?”
How reliable are NIQs?
My take was basically that while NIQs probably have some kind of information content, we should see them as very low-fidelity estimates which could very easily have large errors or biases we aren’t aware of. The new estimates
and Emil Kierkegaard came up with did have quite a number of countries where they made revisions of >7.5 IQ points (i.e. 0.5 SDs of individual variation!) for country averages! That’s huge! Their revisions to these supposedly reliable estimates were equal to generations of change from alleged dysgenesis!What does
say about the data?
Quite literally his take is that he agrees that the data is bad, but he thinks people who oppose his interpretation of the data are bad people.
You can’t make this stuff up!
He goes on:

So individual NIQs are not very reliable, and individual IQ samples that feed into NIQs absolutely suck.
‘s own words folks!So how does he defend the NIQs overall?

“Well, if we take enough garbage, and average it together, we get diamonds!”
Folks, this is only true if the garbage can be reasonably believe to be a more-or-less random draw from the distribution and if you make many draws. But since these datasets have rather few data points in them (few draws) and since the samples are rarely representative, there’s no reason to believe the average is any more reliable than the individual samples.
And we’ve already discussed the external validity issue: in fact NIQs are too externally valid! Just like all the other too-powerful-and-now-debunked spatial regressors are!
Are IQ distributions always normal?
I raised some questions about IQ distributions and etiologies of low IQ: if environmental causes lower IQ as much as postulated then that should drive a somewhat abnormal distribution.
replied by saying, yes, of course African IQ is normal. He gives two sources: this post, which presents zero data on African IQs, and, I shit you not, this footnote:
If you’ve been around academic twitter you know there’s a running gag here, but I just want to point out that I asked a totally legitimate and serious question, and the response really was literally “Just trust me, bro.” That’s the level of science we’ve got going on here.
In sum, I do hope
will put his time-varying IQ estimates somewhere online in an annualized or decadal format, so that researchers can see if time-varying IQ has any discernible connection to other time-varying variables.
why would the prior be that IQ is the same in all nations? that seems like an impossibly uniform prior to me. ergo, IQ is probably vastly different across nations and that’s what we measure. now I think IQ is mostly culturally conditioned, because the europeans and chinese of a thousand years ago must have been retards in some sense. But, it did take a thousand years.