

You Can't Trust the NSFG 2022-2023
New online elements and a terrible sample mean it's clearly wrong

Pew Research Center is continuing the long downward slide in the quality of its family-oriented work this week by reporting on results from the 2022-2023 wave of the National Survey of Family Growth, the formerly-premier standard for fertility surveying in America. Alas, Pew had two major errors: excluding pregnancies, and not noticing the method change in the NSFG. In this post I’ll focus on a second error which is only kind of Pew’s fault. But we’ll briefly open with Pew’s first error.
Pregnancies Matter
If you want to know how many kids people intend to have, there’s a canonical way to ask them.
Ask them how many kids they have (K)
Ask them if they’re pregnant (G)
Ask them if they intend to have any more kids (I)
If yes to #3, ask them how many more kids (N)
If “don’t know” to #3 or #4, follow up by asking them how likely they are to have kids (L)
If they answer above zero to #5, ask them if they ended up having kids, how many would they have (n)
The formula for intentions then is:
Intended Family Size = K + G + (I * N) + (L * n)
In practice, you get about 90-95% of intended family size from K + (I*N). Most intended family size comes from those. But while that’s most intended family size it isn’t all intended family size.
WHy does this matter?
Here’s Pew’s method statement:

Notice what’s missing?
Pregnancies are definitely missing, and the “uncertain but likely” additional children may be missing; it’s not clear if Pew included those.
How much does this matter? Here’s 2022-2023 intentions, using the full NSFG sample, including or excluding G and (L*n).
Here’s how this shakes out:

It’s not a huge gap, but, yes, it’s the difference between 1.85 and 1.8. Pew is a big organization with a big audience, they can afford to spend the extra five minutes to get it right.
Why You Can’t Trust the NSFG 2022-2023
The Pew article also does not contain the word “online.” They apparently did not notice that there was a method change in 2022-2023. Woopsie! As I’ll show below, this has big consequences.
I’ve written about this before, but here I’m going to double down and go harder.
The CDC must issue totally new weights for the NSFG. Why? The currently recommended weights produce massively erroneous estimates for the population. The CDC made a huge error somewhere in their process.
I can prove it. Here’s my arguments:
NSFG had a new untested online component; we know mode changes alter fertility responses.
The NSFG sample is obviously non-representative of the underlying population.
The NSFG sample even in its non-representative form has some bonkers underlying weights.
Re-weighting the NSFG sample fixes much of the issue.
NSFG has about 5600 women in it. The Current Population Survey’s June Supplement had 22,279. All else equal, I trust the bigger sample more.
But all else isn’t equal. The 2022 CPS had relatively similar methods as the 2020, 2018, 2016, 2014, etc, CPS. The 2022-2023 NSFG had totally new methods.
Whereas in 2017-2019 the NSFG was basically 100% face-to-face surveying, the 2022-2023 NSFG was 75% online, for the first time ever!
I’ve shown other examples in prior work that mode changes (like in Monitoring the Future) are clearly biasing fertility intention responses, and I happen to know there’s a paper floating around by some very fine authors showing some related priming effects in the NLSY too, though it isn’t published yet (not me as an author, other people!). I won’t belabor this point: when you switch mode, you change results, that’s just a fact and the NSFG did not do any published pre-test to verify that their approach was sound.
Let’s move on to the real meat: SAMPLE.
The Sample Is Wrong
The NSFG is not designed to estimate how many 27 year olds live in America, nor how many Asians live in America. It’s designed to estimate sexual and fertility traits, especially the kinds of traits that are not measured in other, bigger surveys, like fertility intentions, contraceptive usage, pregnancy outcomes, etc.
But there’s one trait that falls “between” “what NSFG is supposed to measure” and “what other surveys measure better:” parity.
The biggest survey of children-ever-born is the Current Population Survey’s June Supplement. We’re gonna compare the 2018 values for parity in that survey to the 2017-19 NSFG, and then compare the 2022 CPS to the 2022-2023 NSFG.
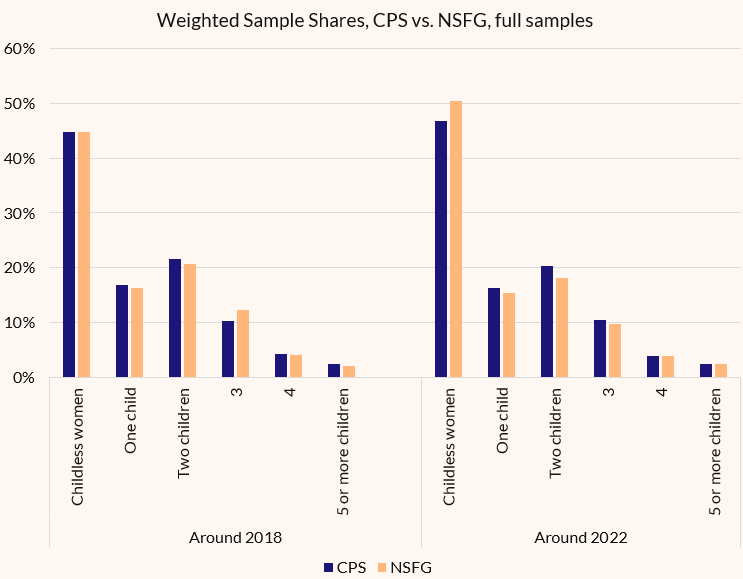
You can see that in 2018, the samples are highly comparable. Yes, the 3-child sample is a bit too big in the NSFG, but that’s mostly just swapping out ones and twos, and 1-3 child women tend to have pretty similar underlying latent traits.
But in 2022, you can see the childless share is WAY oversampled! The gap on childless women is twice as big as the gap on 3-child women in 2018. This is a huge sampling issue.
Who are these women?

You can see 2018 did have some big within-race issues: NSFG hugely undersampled childless hispanic women and two-child Other/Multiracial women.
But the 2018 NSFG errors are kind of random across parities by race: for some races childless are oversampled, for some undersampled, etc.
But in 2022-2023, every single race is oversampled on parity! The biggest oversampling of childless women is for childess Other/Multiracial women who, spoiler, are known to have lower fertility preferences (Asians).
In general childless women also have lower fertility intentions since, as we already noted, most of the statistical mass of fertility intentions is just children-already born. So if you oversample childless women, you mechanically get lower fertility intentions. Especially since, in both absolute and relative terms, the most heavily undersampled group was not 1-child women indicating a small downshift from 1-child to 0-child women, but two child women. Two child women obviously have way higher intentions than zero-child women for mechanical reasons and for substantive preference-based reasons, and so the undersampling on 2 to oversample on 0 has huge effects.
The 2022 NSFG has a hugely biased sample, massively overweighting childless women, especially Other/Asian/Multiracial childless women.
The Weights Are Weird
One way to see how wrong a sample is is to look at weights. Weights are a way we adjust for bad samples. If the distribution of weights in a sample is extremely wide, that means they had a hard time getting what they thought was a representative sample.
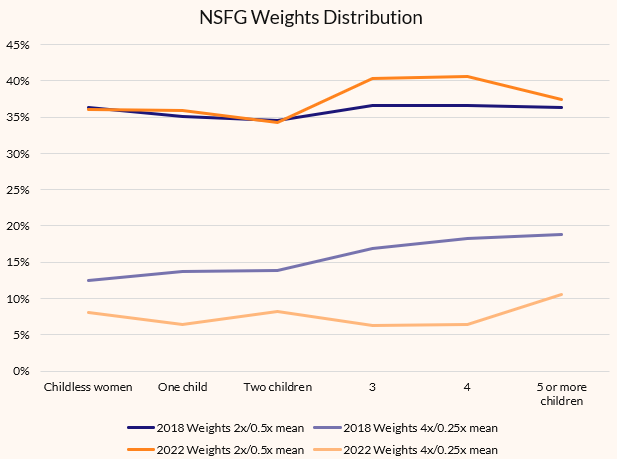
Here’s the distribution of weights by parity for the 2017-19 and 2022-223 NSFG samples:
Do you see what’s weird?
In 2018, the NSFG has a lot more extreme weights at high parities. These turn out to actually be low weights, meaning the 2017-2019 NSFG actually oversampled high-parity women, and yet still had a weighted sample closer to the 2018 CPS!
The 2022-2023 sample has a similar number of extreme weights across the parity distribution, and actually has far fewer extreme weights. This is actually very weird. Extreme weights >4x(<0.25x) the mean should not be just 1/7th as common as weights 2-4x(0.5-0.25x) the mean, that’s a very weird distribution of weights. It looks like what happened is the NSFG sampling team did stricter quota-management than they did in 2017-19, probably specifically to constraint extreme weights. Basically, as they satisifed pre-set quotas by age/race, they capped the sample and went fishing for undersampled groups. This is totally fine and dandy if your quota isn’t on a trait you intend to measure! If you want to measure parity, you can’t quota your sample on parity! And this looks a heckuva lot like a quota on parity! I don’t know if they actually did a quota on partity, but whereas in 2018 they very very clearly did not quota by parity, in 2022-2023 it kinda seems like they did.
Average weights will help us figure this out.

Here, we can see that the 2017-19 wave had similar average weights across the parity distribution: they believed that they had not massively under or oversampled any parity group.
But in 2022-2023, the NSFG staff believed they had undersampled high-parity women (high weights)! Weights rise with parity! And yet they should actually rise even more since we know the weighted distribution overweights childless women!
Okay, now this is all crazy. Let’s do RAW COUNT SHARES. No weights. What share of survey-completers in the 2022-2023 NSFG were at each parity vs. CPS 2022?

Here it’s crystal clear: NSFG hugely oversampled childless women, got one-childs about rate, and undersampled every parity 2+. This is a huge error.
And It Gets Worse
Now let’s put it all together.
NSFG got a weird sample. They also adopted an online survey mode. What were the results of these effects considered jointly?

You can see that both the face-to-face and online samples deviate from CPS, but online in particular oversamples childless women. The face-to-face sample implies a parity mean of 1.26 kids. The online sample implies 1.02. CPS implies 1.15. So the NSFG clearly has mode-specific biases!
This isn’t all a mode-priming effect. Without belaboring the details, it kinda sorta looks like what NSFG did was sample in-person, then use the online mode to sample people they couldn’t reach in person. The result is the neither the online or face to face samples are comparable to 2017-2019 or the CPS, because neither is an independent, random sample.
What effects does this have on intentions? Well, what I’m gonna do past the paywall is that I will reweight the 2022-2023 NSFG to match the parity distributions of the CPS 2022. I will show you how three measures of family size dispositions look over time for the NSFG based on whether we use the base NSFG data, or use the re-weighted data. I will then further show that even this isn’t appropriate, because within demographic groups, the online survey mode appears to have sampled lower-intentions respondents in a selective way. Which means that, ultimately, the 2022-2023 fertility data is unrecoverable. It is flawed in ways we cannot control for, and represents a totally different data-generating process vs. 2017-29.
In sum:
The 2022-2023 NSFG can never be treated as a continuous time series with prior NSFG waves. It represents the start of a wholly new time series.
Keep reading with a 7-day free trial
Subscribe to Lyman Stone to keep reading this post and get 7 days of free access to the full post archives.